Agentic financial analysis · in active development
Every number verified, not just plausible.
Ask plain-English questions about any public company's SEC annual and quarterly reports. Each figure is independently re-derived from source data before you ever see it — and flagged honestly when it can't be confirmed.
Illustrative example while the product interface is finalised.
A second signature on every line
Generic chat tools retrieve a passage and repeat whatever number sits near it. Nothing here reaches your screen until a separate, non-generative check has recomputed it from source.
Reasoning agent
Plans and calls tools over structured financial data to draft an answer, rather than free-generating from memory.
Deterministic re-check
Each numeric claim is re-derived from the normalised source facts — not re-read from the same retrieved snippet.
Answer, or an honest flag
It ships only when both agree. Otherwise the system says the figure is unverified instead of stating it confidently.
Capabilities
Built for due diligence, investment research, and analysis where a wrong number is worse than no answer.
Natural-language Q&A
Ask about revenue, margins, cash flow, debt, or multi-year trends across a company's annual and quarterly reports in plain English.
Independent verification
A dedicated layer re-derives every numeric claim from source data before it is shown, and flags anything it cannot confirm.
Automated company reports
Period performance, peer and industry comparison, narrative-grounded insights, and drivers of change — generated on request.
Interactive drill-down
Explore a chart, then drill into the individual reported data points it was built from without leaving the view.
Unified workspace
Search a company once, then move between Q&A, trend analysis, peer comparison, anomaly alerts, and reports without losing context.
Audit logging
Every question, answer, and verification outcome is recorded, so how an answer was reached is traceable after the fact.
See it in action
One workspace, from question to evidence
Move from a company overview to verified Q&A, generated reports, peer analysis, and administration without losing context.
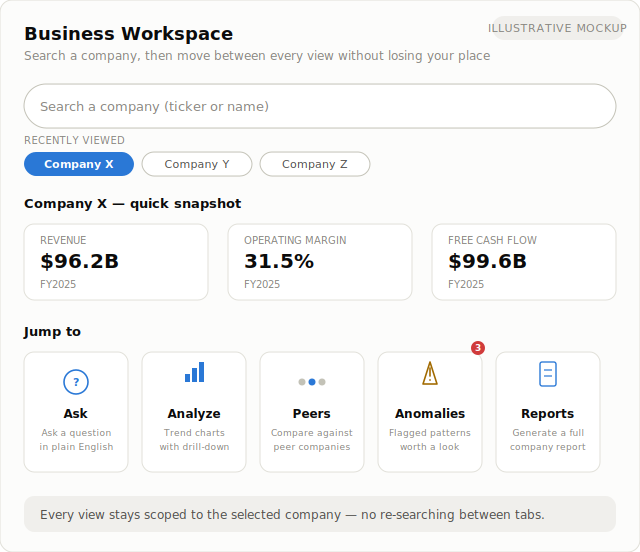
Business workspace
Search a company, see a quick snapshot, then jump to any analysis view.
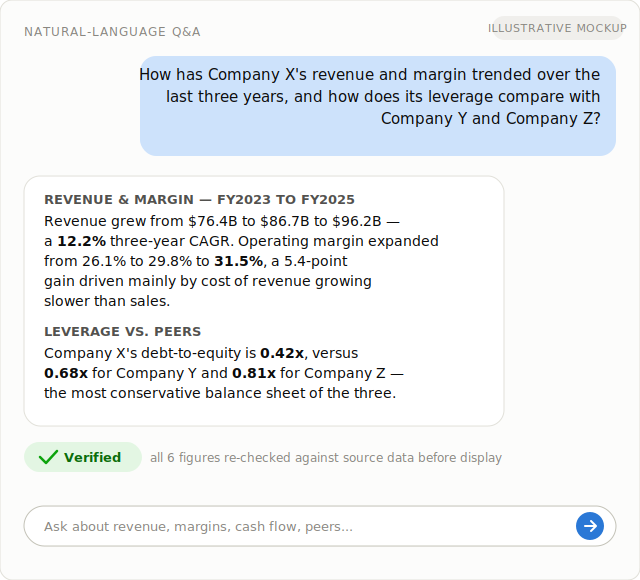
Natural-language Q&A
Ask a question and get a verified answer grounded in reported data.
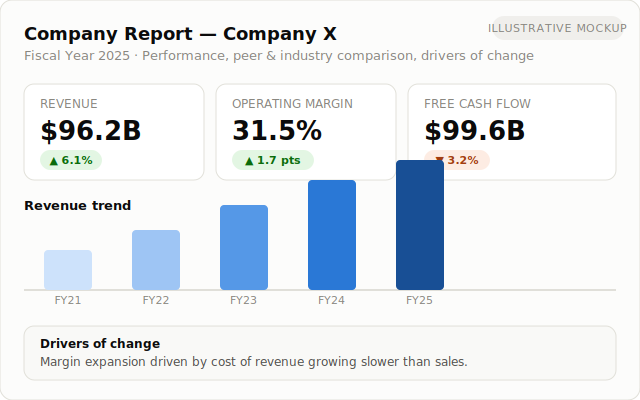
Automated company report
Turn source filings into a structured company view with the key drivers surfaced.
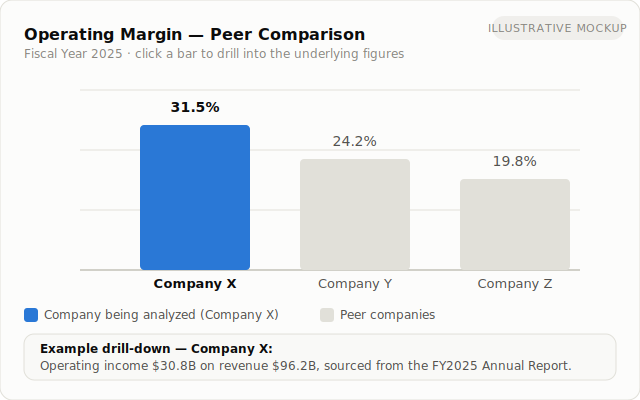
Peer comparison
Compare companies side by side, then drill into the reported figures behind the chart.
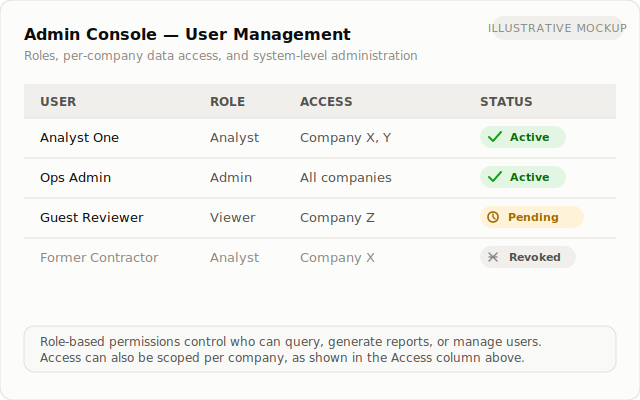
Role-based admin console
Manage access and keep operational oversight in the same environment.
Illustrative product screens while the interface is being finalised.
Less time chasing the number
Analysts stop re-deriving figures by hand, and reviewers stop reconstructing how an answer was reached.
Faster research, lower cost per question
Locating the right report, period, and line item — then cross-checking it — is answered directly instead of by hand.
Scales without proportional headcount
One system covers many companies and questions in parallel, so coverage grows with demand rather than with hiring.
Lowers the cost of bad decisions
An unverified figure in a research note is expensive to catch late. Verification is designed to catch it first.
Reduces manual audit and QA effort
Because reasoning and source data are logged, reviewing an answer does not mean reconstructing it by hand.